
首先復刻大師的經典

二十年後回頭看課本的梯度這章,我想問年輕的我什麼是 dV/dn ,其實還是懂的很含糊,剛好颱風假有兩天,有圖有真相,就把他用 電腦跑一下.先盤點書上出現的數學符號:
V(x,y,z)三維的場:
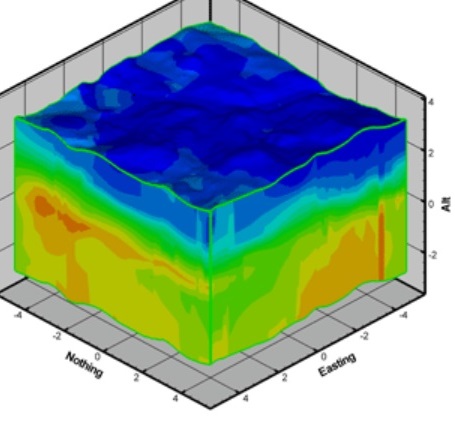
我先讓他等於一個我的亂掰函數,用電腦代入每個點的x,y,z,時,得到温度變化的立體圖,如下
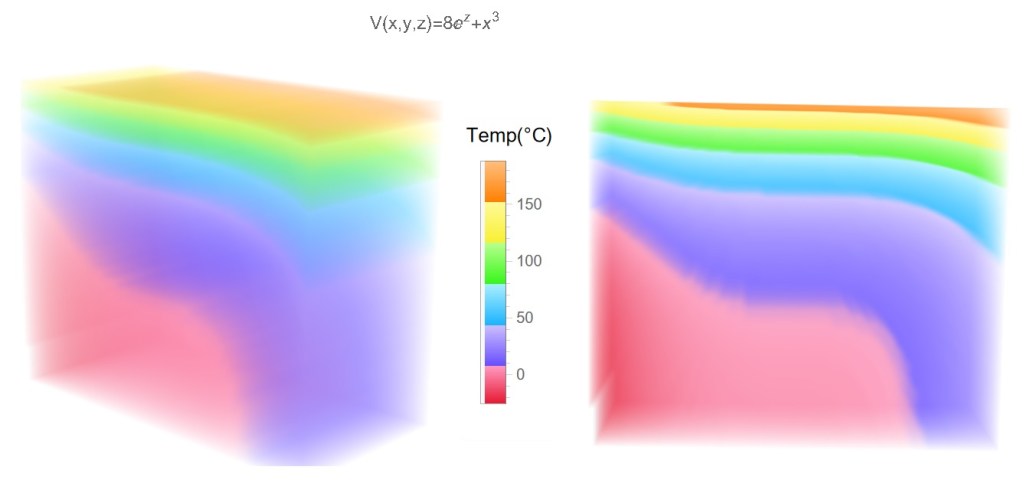
V(x,y,z)為定值:
課本講了很多次,我猜應該是指V(x,y,z)為常數吧,考古一下,用電腦畫一下圖,應該是如下看圖說故事,當用電腦鎖定V(x,y,z)為定值常數,會得到一個同温層/等位面 .温度依我的亂掰函數向上增加.


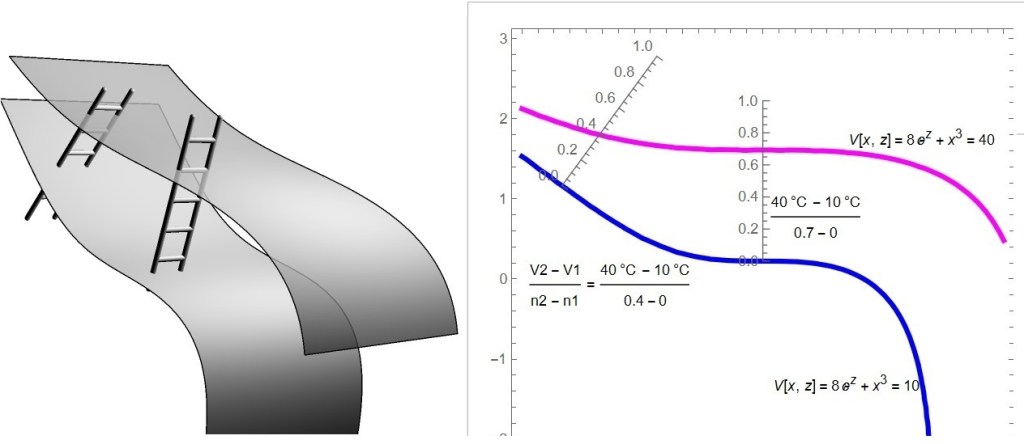
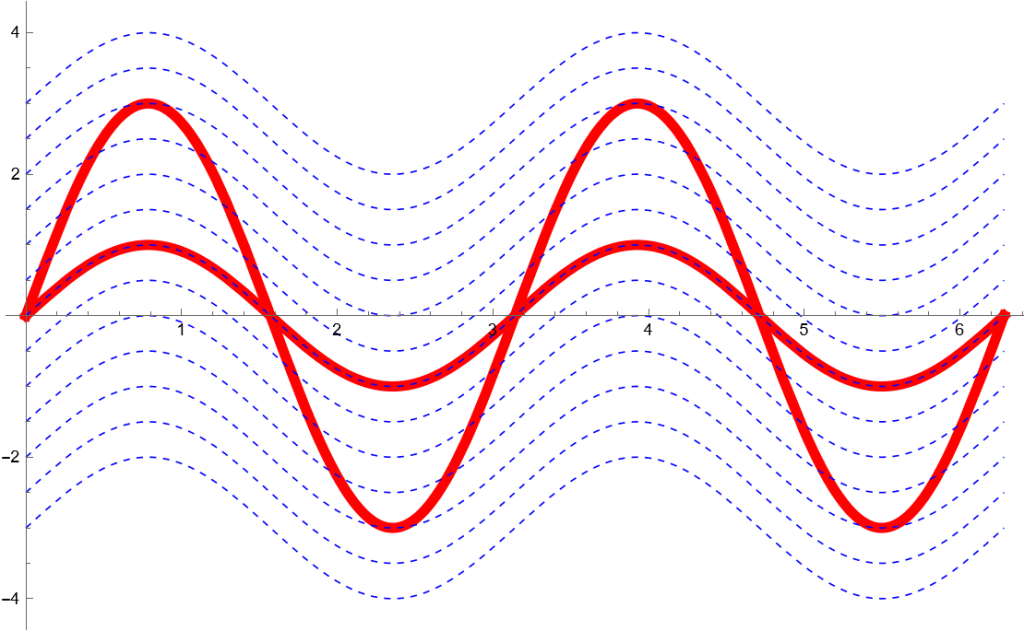
等距離面跟同温層/等距面各有不同.下圖虛線是這個亂掰函數平行藍色的等距離面(Offset Surface).

dV/dn :
如下圖,我的量尺長度是1cm,量到由藍色到紅色線最小距離,左右邊分別量到每釐米温度增加75度跟43度.
V+dV:
這裡我改一下課本內容,用綠色線當成V+dV,左邊右邊向上走尺的一小格0.05cm(dn)後的温度(V+dV)分別是13.5 跟10.95,所以dV/dn 分別是74跟19 .
比較實務的問題,當我的實驗尺刻度最小是1mm ,買來的温度計是量體温那種便宜的(小數一位),,,這時dn 就比1mm小一些,温度到小數2位.

梯度定義:
如果不斷用直尺垂直測量距量,一定會懷疑人生,用格子圖算梯度方便多了.透過下列公式應該就懂了.
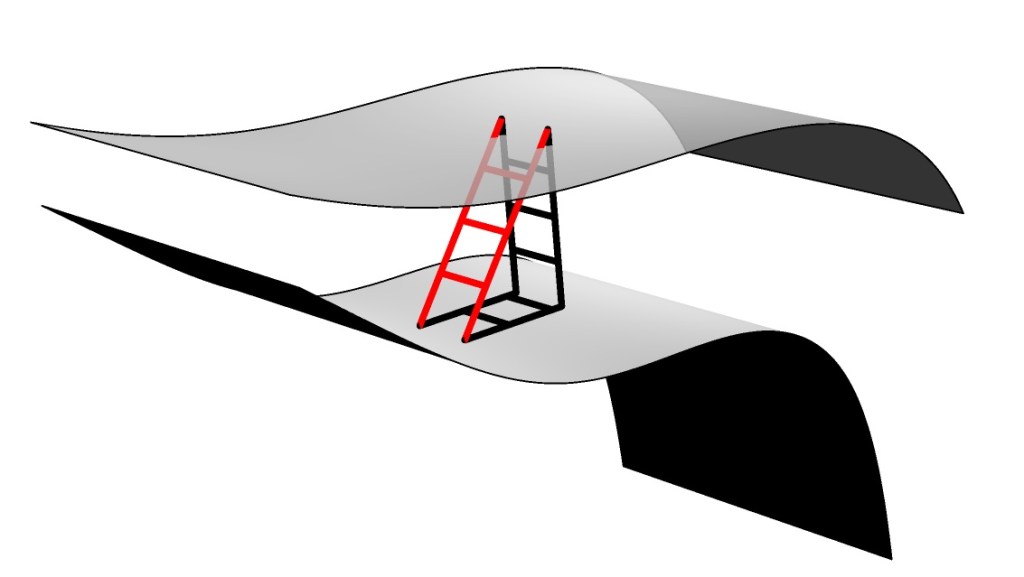
最後,用下圖回應一開始的問題,什麼是梯度,
在場V(x,y,z)裡,把長度為n的梯子擺在你要的位置,且梯子要垂直於這位置的等位面V(x,y,z)為定值,爬梯子到鄰近的點,測量他的物理量相減得dV,的比值(dV/dn)及梯子插的方位(an)

實用的物理定律是不受坐標系方位影響的.—費因曼物理學談梯度時,跨讚梯度這個發明好幾次,如下圖表現在實際地理位置的温度最大變化的方向.(費曼應該是這個意思吧!!)

最後再補一張圖給大猩猩練習,dV dn an及梯子怎麼擺.
梯度是誰翻譯成中文的??
以下是grad字首的英文單字,比較接近的意思是漸變,跟樓梯的關係不太,翻譯成梯度蠻瞎的,因為上述的舉例,是樓梯愈長,dV/dn越小,相信大家跟我一樣深深的跌倒過,翻譯成"漸變度"應該精準些.
我只是舉個例子讓你懂,希望不要誤導你一輩子,希望你永遠保持懷疑.

其他好例子
如下用更專業的流體力學軟體 Tecplot 360 畫的
參考資料
程式碼如下,裡面有一個彩蛋,是利用梯度做出offset curve
(*From https://qhand.work/2023/07/28/grad/*)(*Wolfram Mathematica \
Code V13.2 instal see:https://qhand.work/2022/07/30/install/*)
ClearAll["`*"]
V2D[x_, z_] = 8 E^z + x^3;
\[Del]V2D = \!\(
\*SubscriptBox[\(\[Del]\), \({x, z}\)]\(V2D[x, z]\)\) // Normalize;
density2D =
    DensityPlot[V2D[x, z], {x, -3, 3}, {z, -3, 3},
      AxesLabel -> Automatic, AspectRatio -> Automatic,
      ColorFunction -> "BrightBands",
      PlotLegends ->
        BarLegend[Automatic, LegendMarkerSize -> 180,
          LegendFunction -> "Frame", LegendMargins -> 5,
          LegendLabel -> "Temp(°C)"],
   Mesh -> {{-1.8, -1.2}, {0.7, 1.67}},
      Frame -> False, Axes -> True, AxesOrigin -> {-3, 3},
      Ticks -> {{-3, -1.8, -1.2, 0, 1, 2, 3}, {-3, -2, -1, 0, 0.7,
      1.67,
            3}}];
equalline =
    ContourPlot[{V2D[x, z] == 10, V2D[x, z] == 40}, {x, -3,
    3}, {z, -3,
        3}, AxesLabel -> Automatic, AspectRatio -> Automatic,
      ContourStyle -> {Directive[Thickness[0.01], Blue],
          Directive[Thickness[0.01], Magenta]}, ContourLabels -> True,
      Mesh -> All];
equallineGroup =
    ContourPlot[{V2D[x, z] == 25, V2D[x, z] == 60,
        V2D[x, z] == 90}, {x, -3, 3}, {z, -3, 3},
   AxesLabel -> Automatic,
      ContourStyle -> Directive[Thickness[0.01]],
      ColorFunction -> "DarkRainbow", AspectRatio -> Automatic,
      ContourLabels -> True];
equallineSlide[c0_, color_] :=
    ContourPlot[V2D[x, z] == c0, {x, -3, 3}, {z, -3, 3},
      AxesLabel -> Automatic, AspectRatio -> Automatic,
      ContourStyle -> Directive[Thickness[0.005], color],
      ContourLabels -> True];
h2D[n_] := {x, z} - n*\[Del]V2D;
offsetPlan[n_] := V2D @@ h2D[n];
NormalUnitVector[x_, z_] = \[Del]V2D // N;
equalPointXZ[x0_] :=
    SolveValues[V2D[x, z] == 10 && x == x0, {x, z}, Reals][[1]] //
    N //
      Quiet;
NormalkTimeEqualPointXZ[x0_, k_] :=
    equalPointXZ[x0] +
    k*{1, 1}*NormalUnitVector @@ equalPointXZ[x0] //
      N;

HkTimeEqualPointXZ[x0_, k_] := equalPointXZ[x0] + k*{0, 1.2} // N;

VkTimeEqualPointXZ[x0_, k_] := equalPointXZ[x0] + k*{1.2, 0} // N;
NormalKLine[x0_, k_] := {equalPointXZ[x0],
      NormalkTimeEqualPointXZ[x0, k]};

HLine[x0_, k_] := {equalPointXZ[x0],
      HkTimeEqualPointXZ[x0, k]};

VLine[x0_, k_] := {equalPointXZ[x0],
      VkTimeEqualPointXZ[x0, k]};
Ruler[x0_, k_] :=
    Graphics@
      AxisObject[Line@NormalKLine[x0, 1.2 k], {0, 1.2 k},
        AxisLabel -> "an"];
HRuler[x0_, k_] :=
    Graphics@
      AxisObject[Line@HLine[x0, k], AxisLabel -> "ax",
        TickLabels -> {None, All}];
VRuler[x0_, k_] :=
    Graphics@
      AxisObject[Line@VLine[x0, k], AxisLabel -> "ay",
        TickLabels -> {None, All}];
OffsetCurves =
    ParallelMap[
      ParametricPlot[NormalkTimeEqualPointXZ[x0, #], {x0, -3, 3},
          PlotPoints -> 10, MaxRecursion -> 2, PlotStyle -> Dashed,
          PlotRange -> {{-3, 4}, {-3, 3}}] &, Range[0, 2, 0.3]];
vectors =
    VectorPlot[\[Del]V2D, {x, -3, 3}, {z, -3, 3},
      VectorPoints -> Coarse, AxesLabel -> Automatic,
      VectorColorFunction -> None, AspectRatio -> Automatic,
      VectorStyle -> Black, VectorSizes -> 0.8];
Manipulate[
  showList := {density2D, vectors, equalline, equallineGroup,
      OffsetCurves, Ruler[x0, 1.2], Ruler[x1, 1.2], HRuler[x0, 0.5],
      VRuler[x0, 0.5], equallineSlide[c0, Green]};
  showedList := {den2D, vect, 1, equlins, off, 1, 1, axis, axis, side};
  showedListposition := Flatten@Position[showedList, 1];
  Show@ showList[[showedListposition]]

  ,
  Column[{
      Row[{
          Control[{{den2D, 0}, {0, 1}, Checkbox}],
          Control[{{vect, 0}, {0, 1}, Checkbox}],
          Control[{{equlins, 0}, {0, 1}, Checkbox}],
          Control[{{off, 0}, {0, 1}, Checkbox}],
          Control[{{axis, 0}, {0, 1}, Checkbox}]
          }, Spacer[20]],
      Control[{{x0, -1.8, "RulerA"}, -3, 1.5}],
      Control[{{x1, 0, "RulerB"}, -3, 2}]}],
  Row[{Control[{{side, 0, " "}, {0, 1}, Checkbox}],
      Control[{{c0, 0, "Green"}, 0, 40}]}]
  ]
DictionaryLookup["grad" ~~ ___]